
Evaluating Policy Shifts

The One Big Beautiful Bill (OBBB), long a Republican policy goal, officially became federal law on July 4, 2025. In late June, House Speaker Mike Johnson vowed to send the finalized legislation to President Trump before Independence Day, after the Senate passed its version. He delivered on that promise. The bill narrowly passed the Republican-controlled House with a vote of 218–214. Only two Republicans joined all 212 Democrats in opposition, underscoring the political strength of both President Trump and Speaker Johnson within their party.
The new law is expected to provide a short- to medium-term boost to economic growth. One of its central pro-growth features is the permanent full expensing of most business investments in tangible assets. This allows companies to deduct the entire cost of qualified investments from taxable income in the year they’re made, freeing up capital and incentivizing new spending across industries.
Another major provision is a broad reduction in marginal income tax rates for individuals and families. The top rate for high earners will remain at 37%, while middle and lower income households may realize modest cuts in their marginal tax brackets. In addition, the law increases the standard deduction and child tax credit, providing further support to working families and expanding disposable income.
These tax changes are designed to encourage labor force participation, stimulate consumer demand, and support private-sector investment—all key ingredients for stronger GDP growth.
Despite its growth ambitions, the OBBB carries a substantial fiscal cost. One Congressional Budget Office (CBO) estimate the law will increase federal deficits by an average of $340 billion annually, adding roughly $3.4 trillion to the national debt over the next decade.
Critics warn that these unfunded provisions may ultimately undermine the economic benefits they’re meant to create. Rising deficits could lead to higher interest rates, greater debt service costs, and long-term crowding out of private investment. Some economists argue that rather than stimulating sustainable growth, the bill could place further strain on the U.S. dollar and global investor confidence in U.S. fiscal policy.
“The new law is expected to provide a short- to medium-term boost to economic growth and support private-sector investment.”
Markets are already watching how the OBBB affects inflation, interest rates, and capital flows. In the near term, the combination of tax stimulus and ongoing trade tensions may prompt some investors to diversify globally or shift toward inflation-hedging strategies.
Still, inflation dynamics depend on more than fiscal deficits. Structural forces like technological innovation, demographic shifts, and labor market policy will also shape price pressures over the long run. If productivity continues to rise and incentives support workforce participation, inflation may remain in check, even amid rising debt.
Tariffs
There have been almost daily developments with many of our major trading partners, including China, Mexico, Japan, Canada, and the European Union. While the administration initially targeted July 9 for trade deals to avoid stricter “Liberation Day” tariffs, there have been mixed signals regarding extensions for countries negotiating in “good faith”. Treasury Secretary Scott Bessent’s goal is to complete the balance of the most important trade talks by Labor Day.
The impact of tariffs on the US economy and global trade is becoming increasingly evident, presenting a complex picture of both fiscal benefits and economic shifts. In the first quarter, our deficit surged to a record high of over $450 billion, driven primarily by businesses “front-loading” imports to avoid President Trump’s new tariffs. This deficit now represents around 6% of gross domestic product, the highest since 2006. While the initial import flood has reportedly subsided, if the deficit were to continue, it could pose a long-term risk to the dollar’s “safe haven” status.
Retail sales in May declined by 0.9%, attributed in part to the end of the tariff “front-loading”. The data suggests overall consumption remains healthy for now, but is raising concerns that the clear impact of tariffs on prices hasn’t yet been fully realized.
Some good news on tariffs is the associated revenue for the US government. The Congressional Budget Office projected tariffs could reduce primary deficits by $2.8 trillion over the coming decade, assuming current duties remain constant. This surge has seen tariff revenue increase from about 2% to almost 5% of total federal revenue.
The ripple effects of tariffs are also impacting monetary policy globally. In Europe, three central banks – Switzerland, Sweden, and Norway – cut interest rates recently in response to unpredictable trade policies. This stands in stark contrast to the “wait-and-see” approach in the US, partly due to differing tariff impacts and labor market conditions.
Middle East Tensions
In what quickly became a rapidly escalating situation, President Trump approved US attacks on three Iranian nuclear weapons sites on June 21. The US involvement, specifically with “bunker buster” bombs, was deemed necessary to penetrate deeply buried facilities. This came after weeks of negotiations between the US and Iran over its nuclear program, which were interrupted by Israel’s offensive. Despite the significant strikes, it remains uncertain whether all of Iran’s nuclear program targets were destroyed.
“Markets stabilized quickly thereafter with President Trump announcing a pause in hostilities, offering brief relief amid rising global tensions.”
The financial markets initially responded with significant concern over this deepening Middle East conflict, especially given fears of squeezed oil supply and a broader escalation into full-blown war. But markets stabilized quickly thereafter with President Trump announcing a pause in hostilities.
Despite the recent signs of deescalation and market relief, the situation remains highly fluid and complex. Iran maintains it will not negotiate while the Israeli assault continues. The potential for future escalation remains a key concern, with warnings that Iran could still target US ships and bases in the region. Further, Iran might fully end cooperation with international inspectors and sprint towards a nuclear weapon. Finally, the threat of Iran closing the Strait of Hormuz, a transit point for 20% of the world’s oil, still looms, which could significantly add to inflationary pressures.
Federal Reserve
The Fed is experiencing intensifying pressure from President Trump to lower interest rates. Trump argues that rate cuts are crucial for bringing down the surging cost of government debt. Treasury figures show there has been a sizable increase in the interest expense paid by the US compared to the prior fiscal year, and it also now outpaces defense spending. Furthermore, a wave of maturing debt by year-end will need to be refinanced at much higher costs than when it was issued, adding to the fiscal challenge.
“Fed Chair Powell maintains a ‘wait and see’ strategy, emphasizing the central bank is well-positioned to pause and assess how tariffs and geopolitical tensions might impact inflation and economic stability.”
Lowering rates without economic justification could backfire by stoking inflation fears and reducing demand for Treasuries. Ultimately, the Fed’s primary mandate is price stability and maximum employment, not addressing or managing the fiscal situation. This is why maintaining independence for the Fed is key to ensure a clear focus on these two stated mandates.

Even within the Fed, there is a divide on the future path of interest rates. Fed Chair Powell maintains a “wait and see” strategy, emphasizing that the central bank is “well-positioned to wait” for more clarity on how President Trump’s tariffs will affect inflation and the broader economy. The Fed’s preferred inflation gauge, the Personal Consumption Expenditures (PCE) index, accelerated in May, rising above expectations.
The flip side argument of the “wait and see” approach is the downside risks to employment and the potential signs of fragility in the labor market. Recent economic data reflects this softening, with continuing jobless claims rising as of late and first quarter GDP contracting more than previously reported.
Further, geopolitical tensions in Iran further complicate the outlook. On one hand, oil prices could potentially rise and add to inflationary pressures. On the other hand, this conflict could lead to earlier rate cuts due to potential demand shocks.
Stocks
Overall, stocks had another great month in June, continuing their rally. Initially, equity markets were shaken by the Middle East conflict, but by June 24, had rebounded. This “relief rally” was primarily driven by growing optimism around a fragile US-brokered ceasefire between Israel and Iran, raising hopes for a lasting end to regional hostilities. Tariffs also contributed to uncertainty in the equity markets, but haven’t seemed to slow down strong momentum. Finally, the markets seem hopeful of rate cuts this year as well, which may be part of the reason for strong returns as of late.
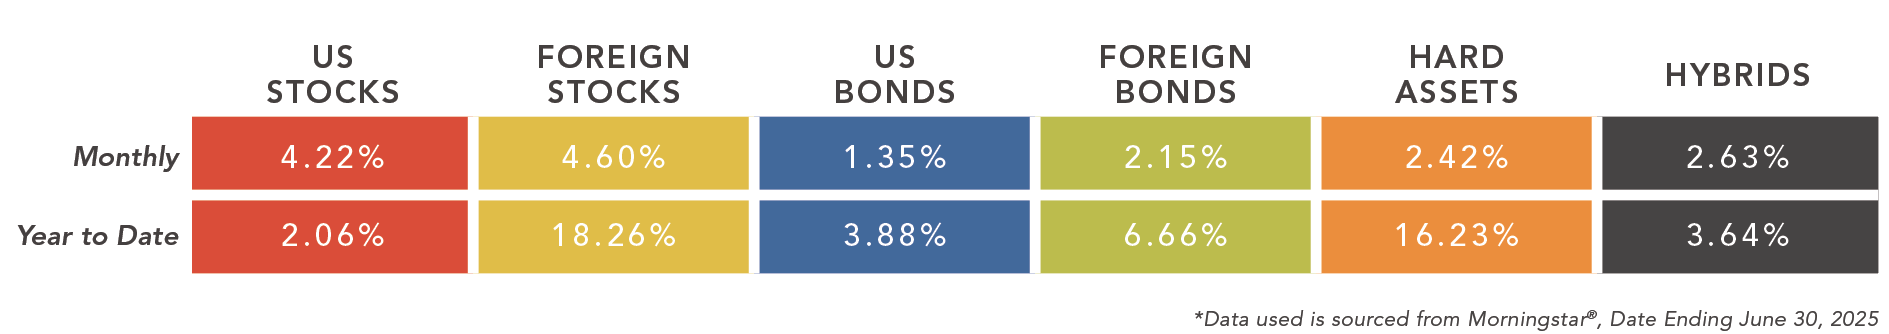
US large cap stocks outperformed small caps for the month of June, which widened the year-to-date return gap to approximately 10%. Small caps are down for the year, whereas large caps have posted solid returns.
Foreign markets were up for the month of June, slightly less than comparable US stocks. However, the year-to-date returns for foreign stocks are relatively massive, in the 20% range. Foreign diversification has been a tremendous advantage in the equity markets over the last year, with global trade serving as the catalyst for this new market trend.
There has been no shortage of uncertainty for stocks when considering global trade developments, Federal Reserve action, inflation, employment data, and global conflicts. Yet, the global equity markets have faced this uncertainty very well, demonstrating robust resilience.
Bonds
Short-term bond yields are influenced heavily by the Fed. Because there have been no rate cuts recently, short-term bond rates have stayed fairly consistent since the beginning of the year. Intermediate and long-term bond yields have been somewhat volatile since the beginning of the year for a variety of reasons. One item being closely watched is the growing national debt, which may cause some long-term implications for US bond yields.
Long-term bonds rebounded quite nicely during the month of June, which also helped boost their year-to-date total returns into positive territory. Long-term bond yields currently stand close to 5%, which is a respectable target return for many investors. Intermediate and shorter-term bonds haven’t performed quite as well in June, but have provided much more attractive three and five year average total returns relative to long-term bonds.
Foreign bonds posted respectable returns in June and have actually been some of the best performing bonds since the beginning of the year. Similar to foreign equities, foreign bonds have experienced very strong performance relative to US assets. With that said, current yields of foreign bonds are relatively lower than comparable US bonds.
High yield, or lower quality bonds, continue to generate respectable returns for investors. These are some of the only bond sectors that have generated attractive, longer-term total returns. Further, lower quality bonds are generally providing interest rates in the 7 to 8% range.
© Advisory Alpha. Registration with the SEC or state does not constitute an endorsement of the firm by regulators, nor does it indicate that the adviser has attained a particular level of skill or ability. This content is for informational purposes only and does not intend to make an offer or solicitation for the sale or purchase of any securities. Investing involves risk, including the potential loss of principal. No investment strategy, such as asset allocation or diversification, can guarantee a profit or protect against loss in periods of declining values. All investment strategies involve risk and have the potential for profit or loss. Changes in investment strategies, contributions or withdrawals, and economic conditions may materially affect the performance of your portfolio. There are no assurances that a portfolio will match or outperform any particular benchmark. Investors should carefully consider the investment objectives, risks, fees, and expenses before investing. Any financial services firms referenced in this material do not provide tax or legal advice. Please consult with your tax or legal professional regarding specific issues prior to making a tax or legal decision.
The performance information presented in the asset category section of this report is based on equal-weighted averages of the following Morningstar Categories: US Stocks (US Fund Large Blend, US Fund Mid-Cap Blend, US Fund Small-Blend), Foreign Stocks (US Fund Foreign Large Blend, US Fund Foreign Small/Mid Blend, US Fund Diversified Emerging Mkts), US Bonds (US Fund Intermediate Government, US Fund Inflation-Protected Bond, US Fund Corporate Bond, US Fund High Yield Bond, US Fund Bank Loan), Foreign Bonds (US Fund World Bond, US Fund Emerging Markets Bond), Hard Assets (US Fund Commodities Precious Metals, US Fund Commodities Energy, US Fund Global Real Estate, US Fund Real Estate), Hybrid Assets (US Fund Convertibles, US Fund Preferred Stock).
© 2025 Morningstar. All Rights Reserved. The information contained herein: (1) is proprietary to Morningstar and/or its content providers; (2) may not be copied or distributed; and (3) is not warranted to be accurate, complete, or timely. Neither Morningstar nor its content providers are responsible for any damages or losses arising from any use of this information. Past performance is no guarantee of future results. Morningstar category data is provided for illustrative purposes only to demonstrate a hypothetical investment vehicle represented by a group of similar investments. Morningstar category data is an aggregation across actual funds contained in the category, but it is not possible to directly invest in a category. Index returns are provided for illustrative purposes only to demonstrate a hypothetical investment vehicle using broad-based indices of securities. Unmanaged indexes are not available for direct investment. All data shown does not include internal fund expenses, trading costs, financial advisor fees or commissions, or taxes. This information is not intended to predict the performance of any specific investment or security. Past performance is no guarantee of future results.
Bureau of Labor Statistics. Unemployment Rate, Total Nonfarm Employment, Labor Force Participation, Consumer Price Index, Producers Price Index. www.bls.gov. United States, Department of Commerce, Bureau of Economic Analysis. Personal Consumption Expenditures, Gross Domestic Product, Consumer Spending, Personal Income and Outlays. www.bea.gov. Federal Reserve. Fed Funds Rate, Fed Funds Target Range, Minutes of the Federal Open Market Committee, Board of the Federal Reserve System Calendar. www.federalreserve.gov. Trump, Donald. @realDonaldTrump. Truth Social.